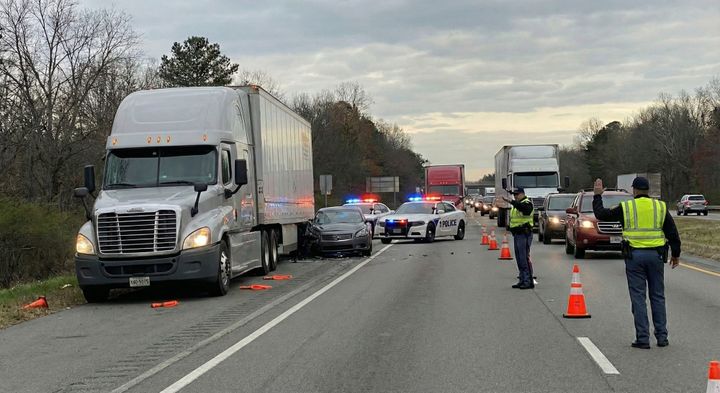
Anatomy of a Shell Company: Exposing a Hidden Freight Network Before It Strikes See how tracing physical trucks through network graphs exposed the massive, hidden chameleon carrier fleet behind the AJ Partners crash.
Why Traditional Carrier Vetting is Failing (And How to Actually Catch a Chameleon) Public FMCSA data can't catch a chameleon carrier. Learn how mapping historical data and social listening exposes hidden freight fraud before it strikes.
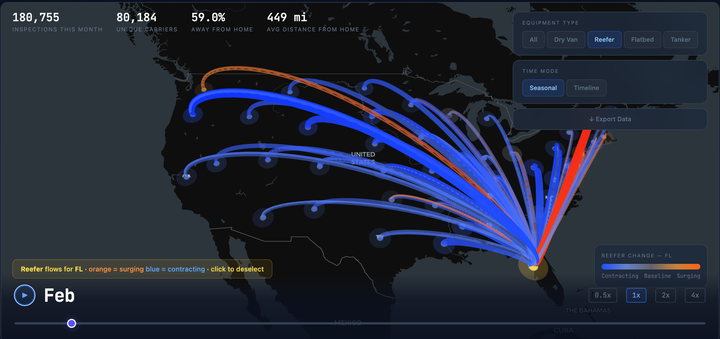
Tracking Truck Migration Across 50 States: What 9.5 Million Inspections Reveal We tracked where 9.5M trucks were registered vs. inspected. The result: a seasonal migration map of US freight - reefers chasing the harvest, capacity retreating south in winter.
America's Most Dangerous Roads: A Data-Driven Analysis Analysis of 1.3M DOT crash records reveals America's most dangerous roads when normalized by traffic volume. I-80 in Wyoming tops the list with 277 fatalities.
One Year Into the English Language Crackdown: What 56,000 Violations Reveal Seven months after FMCSA began placing drivers out-of-service for English proficiency violations, we revisit the data. 45,766 violations in 2025 vs. 2,389 in 2024 - and the patterns reveal exactly who's getting hit hardest.
Who's Buying 2026 Trucks? The Data Tells a Surprising Story Who's buying 2026 trucks? Owner-operators are outpacing mid-sized fleets by 42%. Freightliner's Cascadia 126 leads with 7,664 units. And some carriers are refreshing 20%+ of their fleet while others sit below 1%.
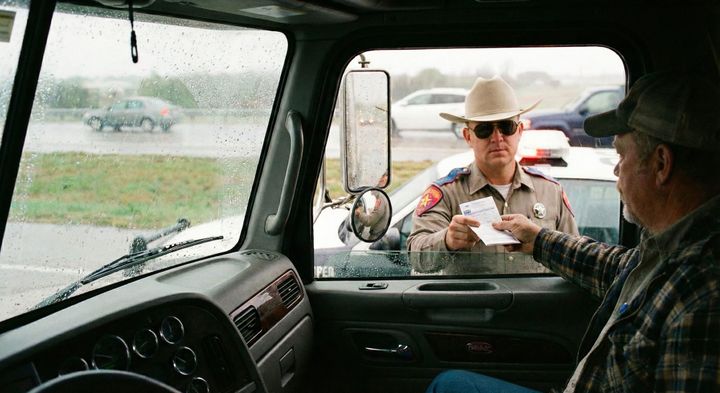
The Worst Places to Get Inspected: Where Commercial Vehicle Inspections Take the Longest An analysis of 8.4 million inspection records reveals dramatic differences in inspection times across the United States.