The Citation Is the Warning Federal inspection records show crash risk spikes in the weeks right after a citation, and that the warning falls hardest on the carriers who can least afford it.
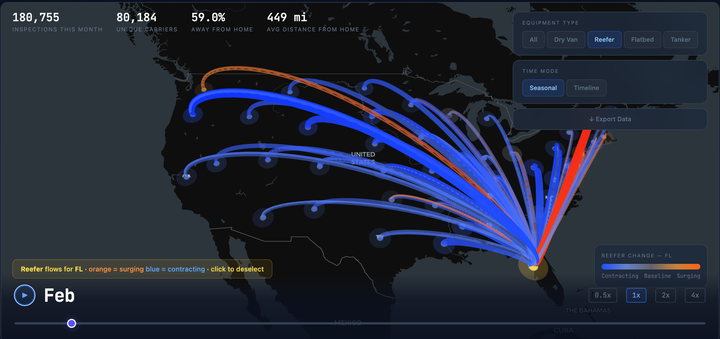
Tracking Truck Migration Across 50 States: What 9.5 Million Inspections Reveal We tracked where 9.5M trucks were registered vs. inspected. The result: a seasonal migration map of US freight - reefers chasing the harvest, capacity retreating south in winter.
One Year Into the English Language Crackdown: What 56,000 Violations Reveal Seven months after FMCSA began placing drivers out-of-service for English proficiency violations, we revisit the data. 45,766 violations in 2025 vs. 2,389 in 2024 - and the patterns reveal exactly who's getting hit hardest.
The Worst Places to Get Inspected: Where Commercial Vehicle Inspections Take the Longest An analysis of 8.4 million inspection records reveals dramatic differences in inspection times across the United States.
Brake Safety Week 2025: 60% Year-Over-Year Increase Marks Record Week for Violations During the week of August 24-30, 2025, commercial vehicle inspectors across North America conducted their annual Brake Safety Week enforcement campaign. The numbers from this intensive inspection period are now in.
Commercial Vehicle Enforcement Trends: 2022-2024 The Data Behind the Headlines An analysis of 12.9 million commercial vehicle violations across 4.5 million inspections reveals significant changes in enforcement patterns from August 2022 through August 2024. These shifts reflect evolving regulatory priorities, technological capabilities, and state-level enforcement strategies that are reshaping the compliance landscape.
Measuring What Matters: A Data-Driven Look at Driver Out-of-Service Rates A comprehensive analysis reveals that carrier age and fleet size are the dominant predictors of driver safety performance, with new carriers showing 4x higher OOS rates than veterans and small fleets recording 37x higher rates than mega carriers.