
Who Insures the Trucks That Crash

We took three decades of federal truck-crash records and matched every wreck to the liability policy that was in force that day, pulling both the historical filings and the current in-force book, then asked which insurers were standing behind the wheel.
Every year, tractor-trailers and heavy trucks are involved in roughly 150,000 reportable crashes on American roads. Behind almost every one of those trucks sits an insurance company: the firm that filed the federal liability coverage the carrier is required to carry. That connection is rarely drawn. Crash data lives in one federal system; insurance filings live in another. This analysis joins them.
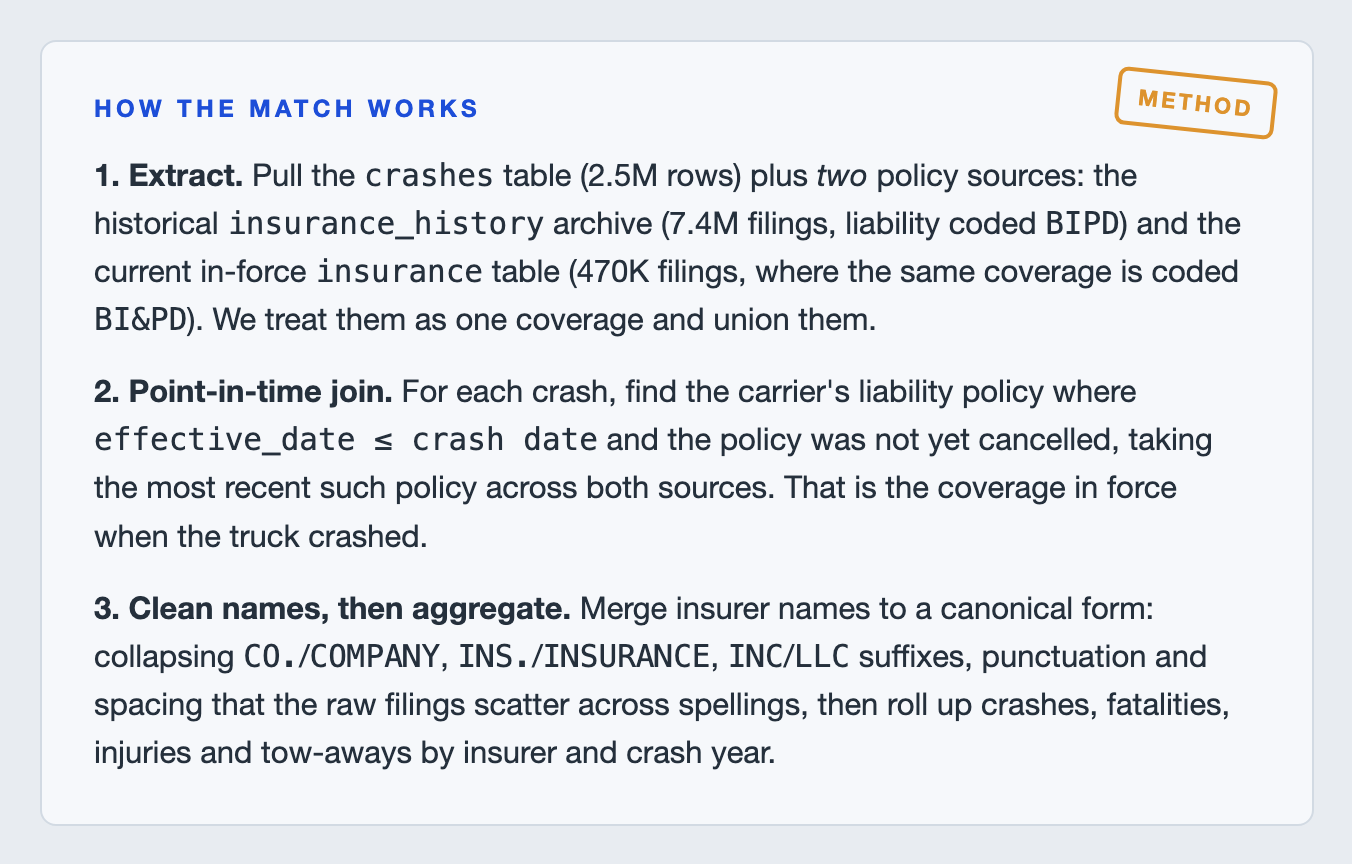
Using the Federal Motor Carrier Safety Administration's crash file and its companion insurance filings, we matched each crash to the primary liability policy (the BIPD filing) that was active on the crash date for that carrier's USDOT number. Crucially, we drew on two policy sources at once, the historical filing archive and the current in-force insurance table, so a carrier's coverage is visible even in the most recent years the archive hasn't caught up on. The result is a ledger no single agency publishes: crashes attributed to the insurer that was actually on the hook, aggregated by company and by year.
Of 2,494,172 crash records with a usable carrier ID and date, 1,629,085, about 65.3%, mapped to an in-force liability policy. The rest had no matching filing for that DOT at that moment. Everything that follows describes the matched subset.
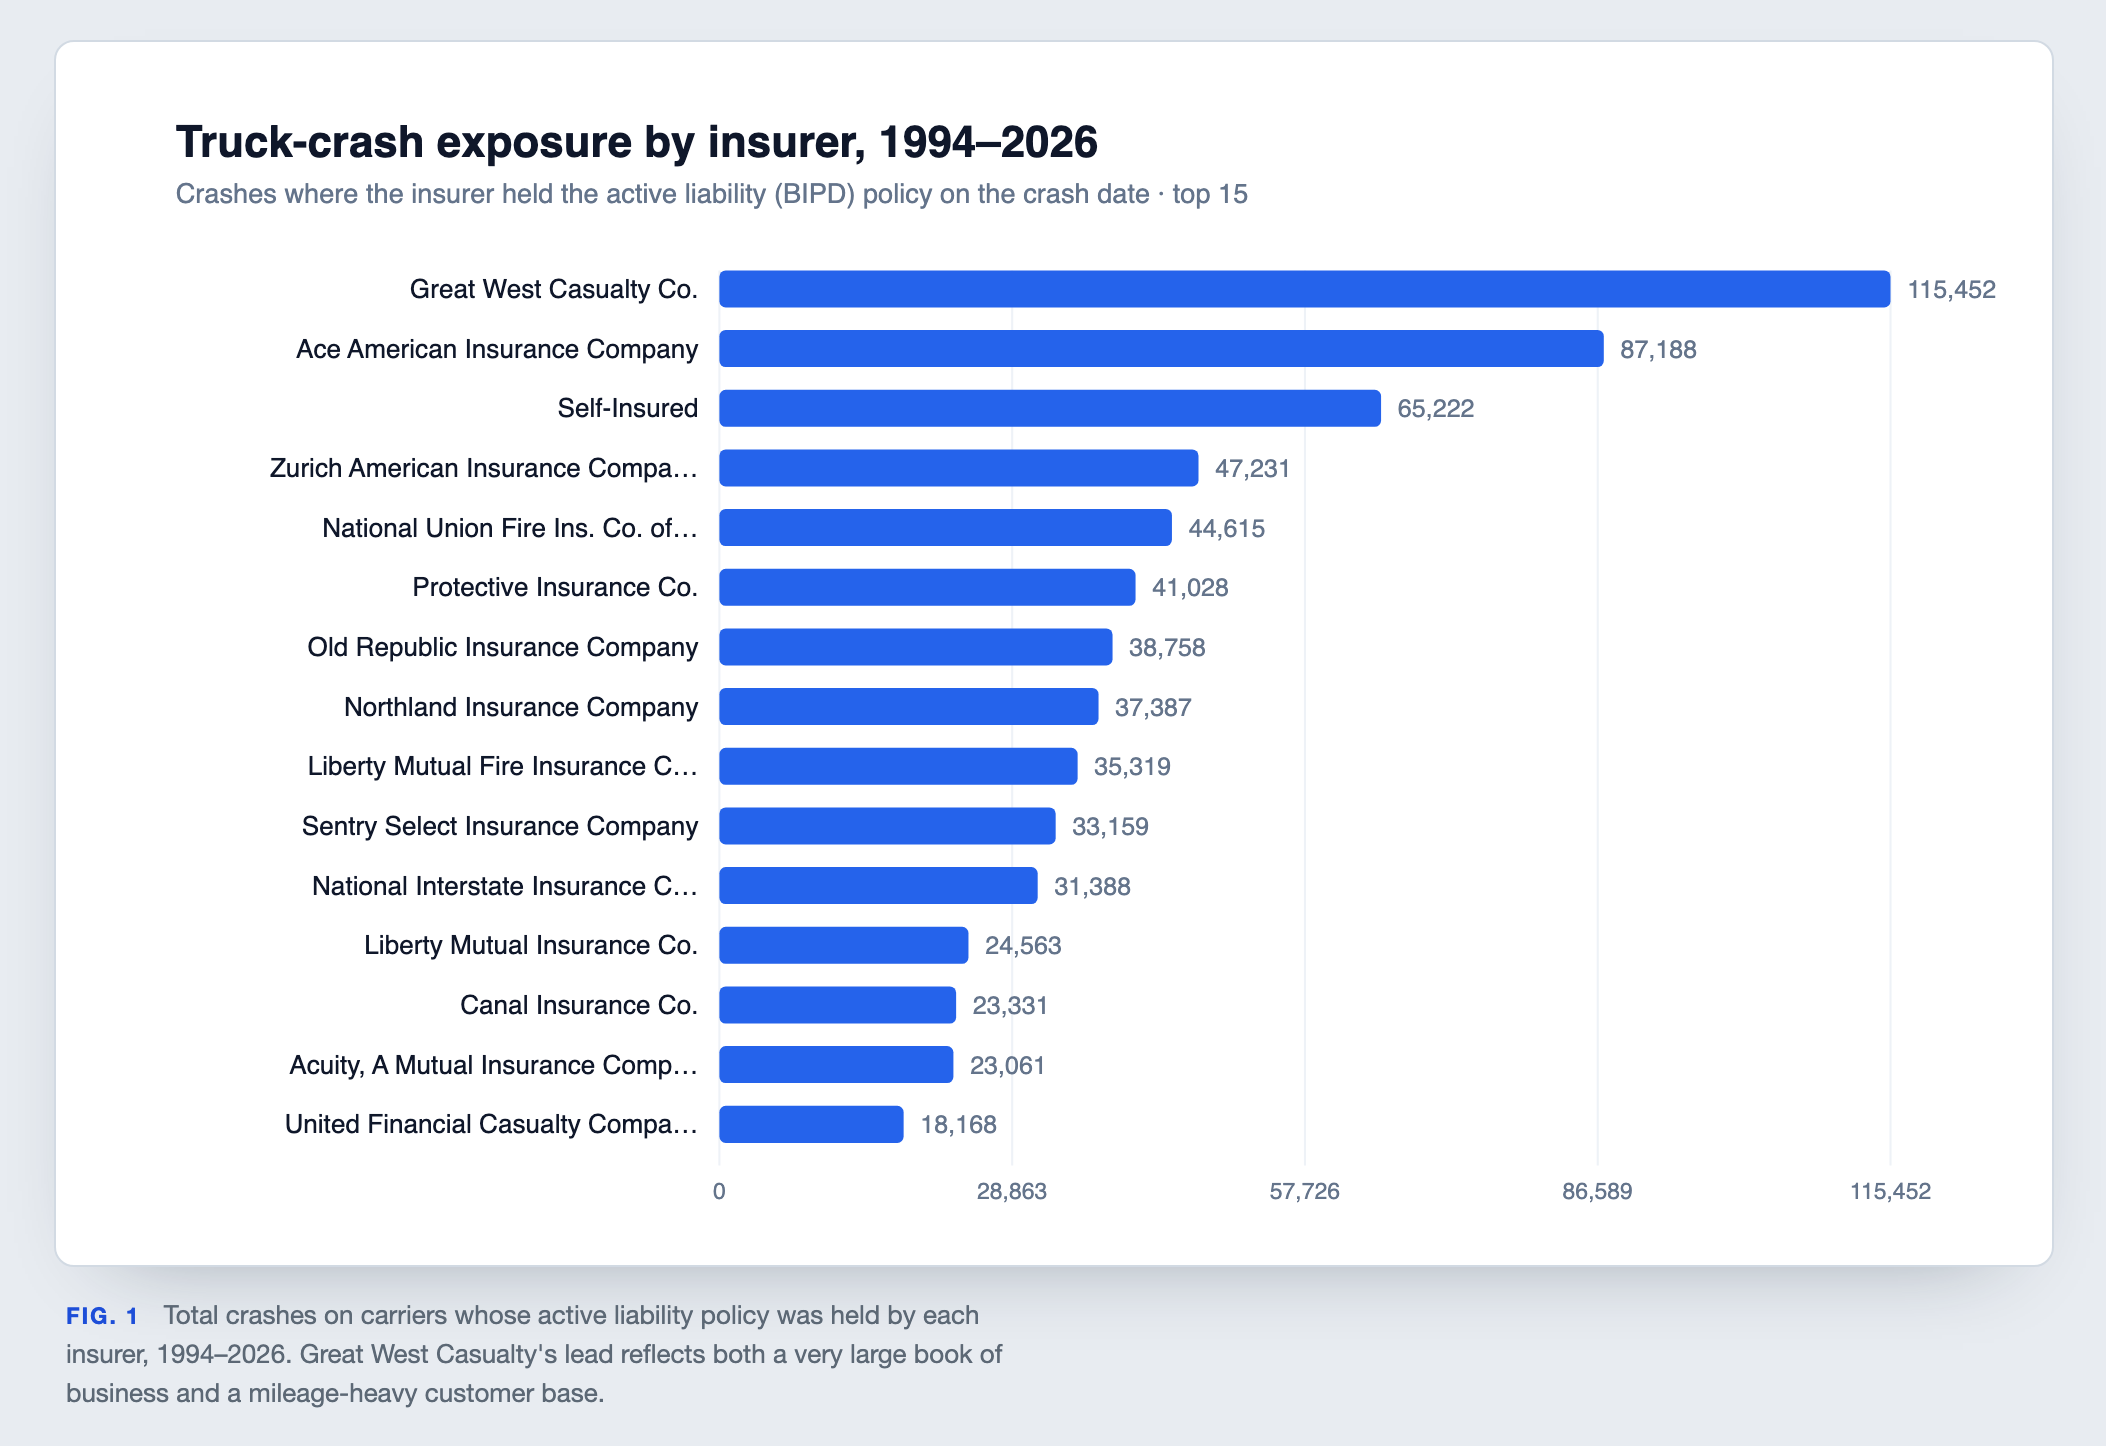
The giants of crash exposure
Who is named on the most wrecks, and it is not a household auto-insurance brand.
The insurers that appear on the most crashes are the specialists of the trucking world. Great West Casualty tops the table, tied to 115,452 matched crashes: it covers roughly 138,000 carriers, many of them long-haul fleets that rack up miles and therefore incidents. The name cleaning matters here: in the raw filings Great West alone was split across several spellings, and folding them together sharpens the count rather than inflating it. Behind it sit Ace American (87,188), a large self-insured bucket (65,222), and the commercial-auto arms of Zurich (47,231), AIG's National Union (44,615), Protective (41,028), Old Republic (38,758), Northland (37,387) and Liberty Mutual.
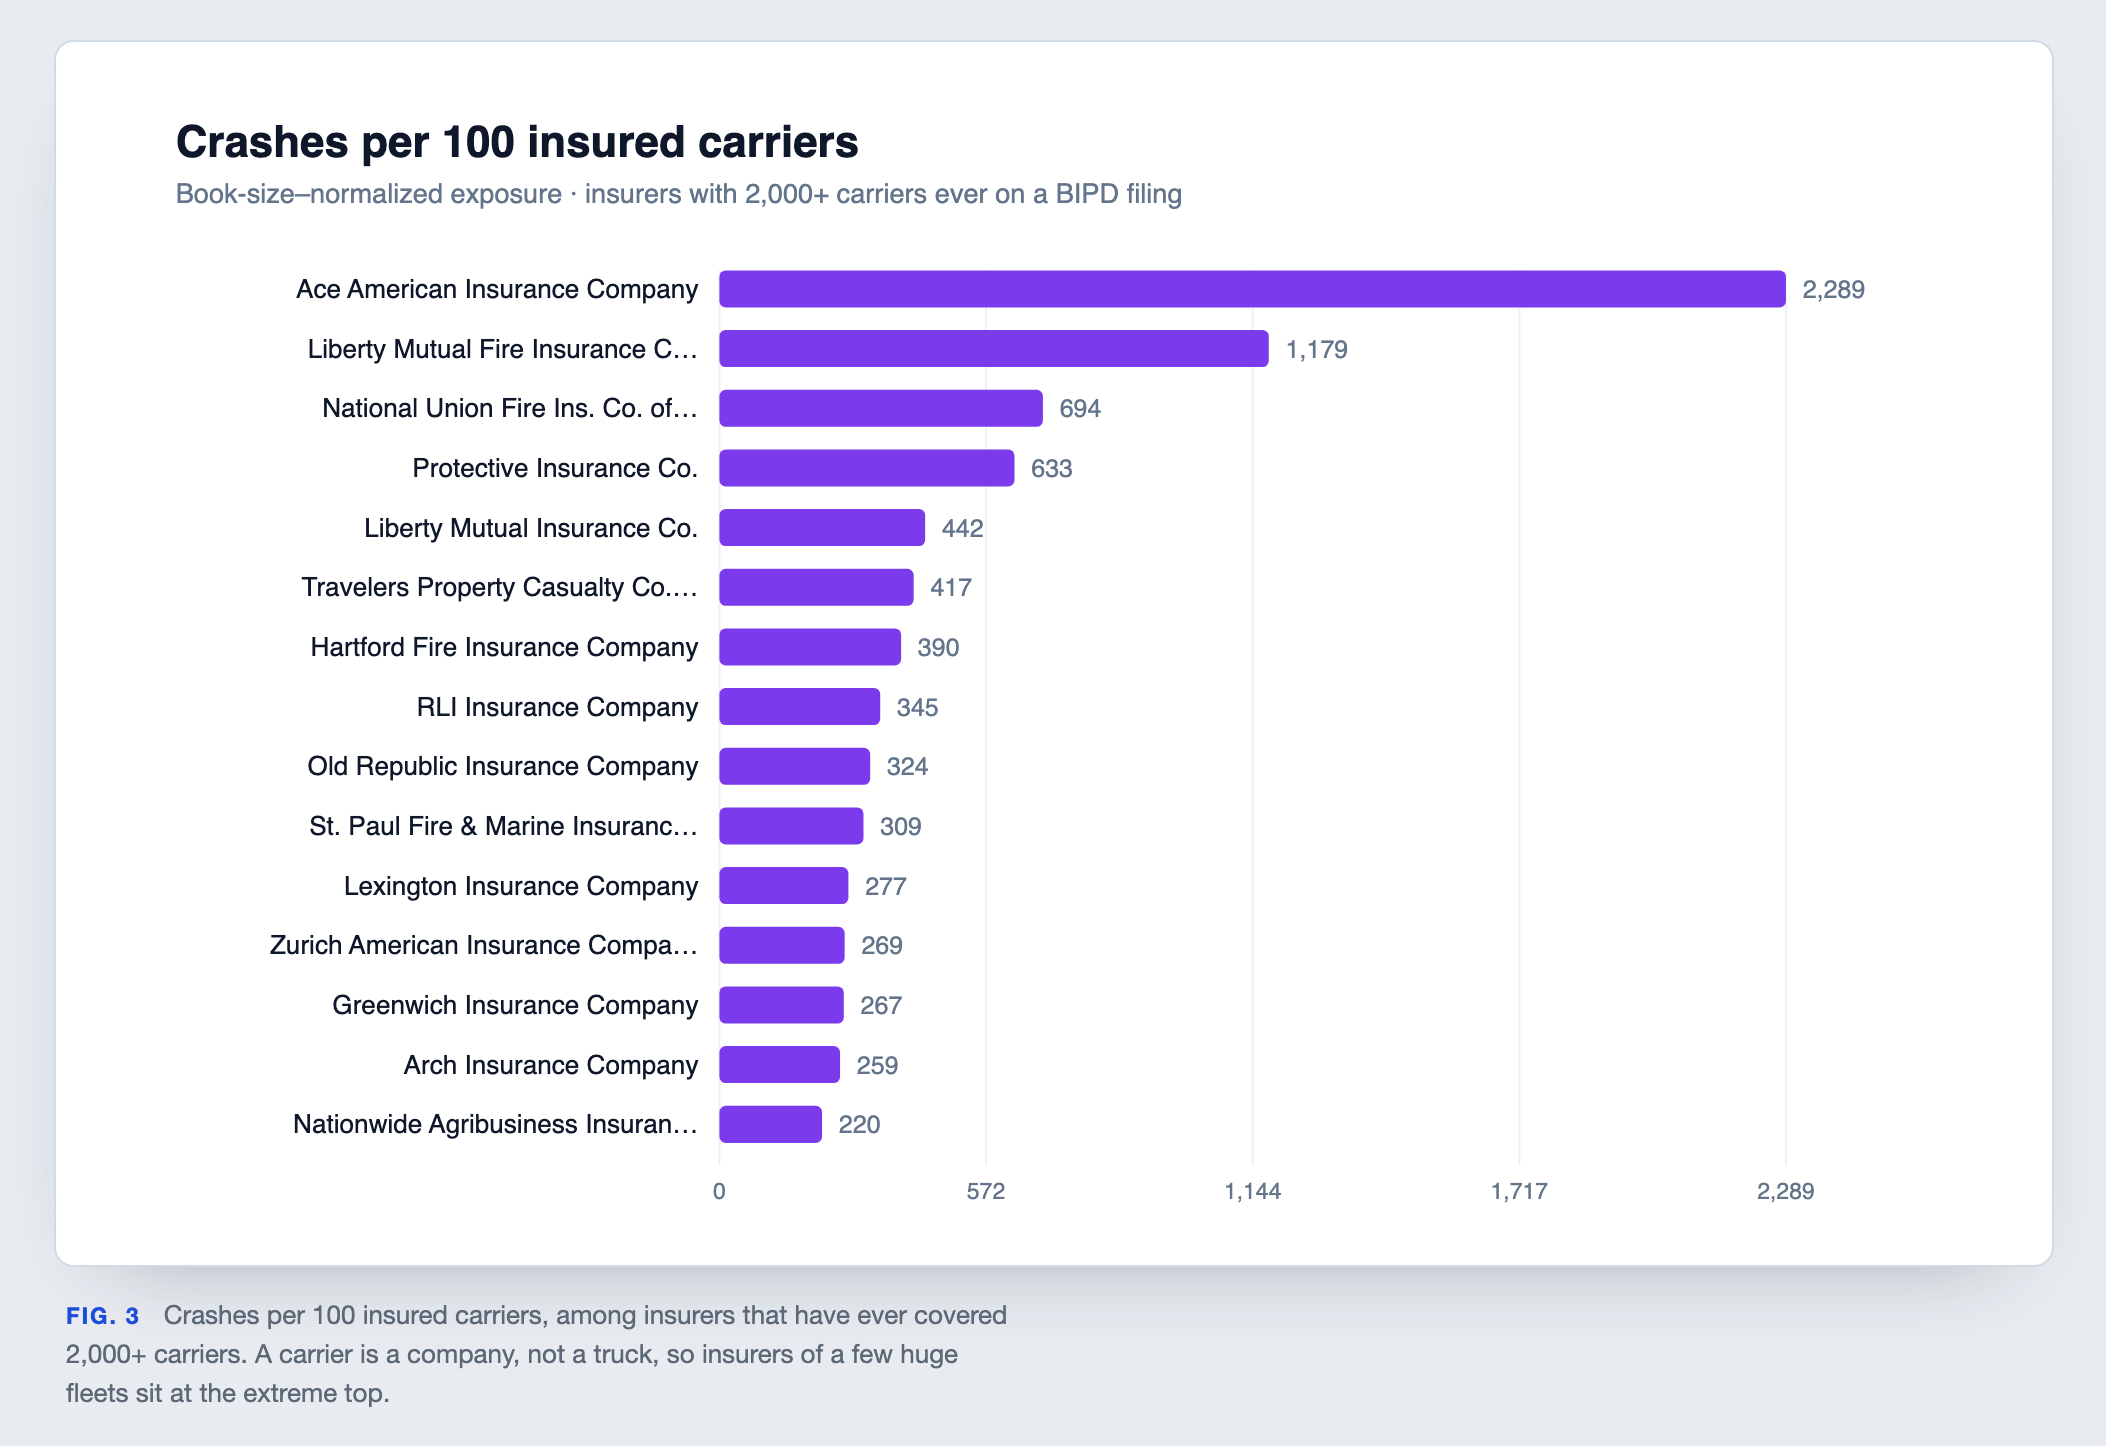
Normalize for the book
Big insurers have more crashes for the same reason big cities have more traffic. So divide.
Raw counts reward size. A fairer question is how many crashes an insurer's carriers generate relative to how many carriers it covers. On that measure the ranking scrambles. Ace American leaps to the front: it covers only about 3,800 carriers but they are enormous fleets, producing nearly 2,300 crashes per 100 insured carriers. Liberty Mutual, National Union and Protective follow. This is less a safety indictment than a portrait of who writes the mega-fleets versus who writes the owner-operators.
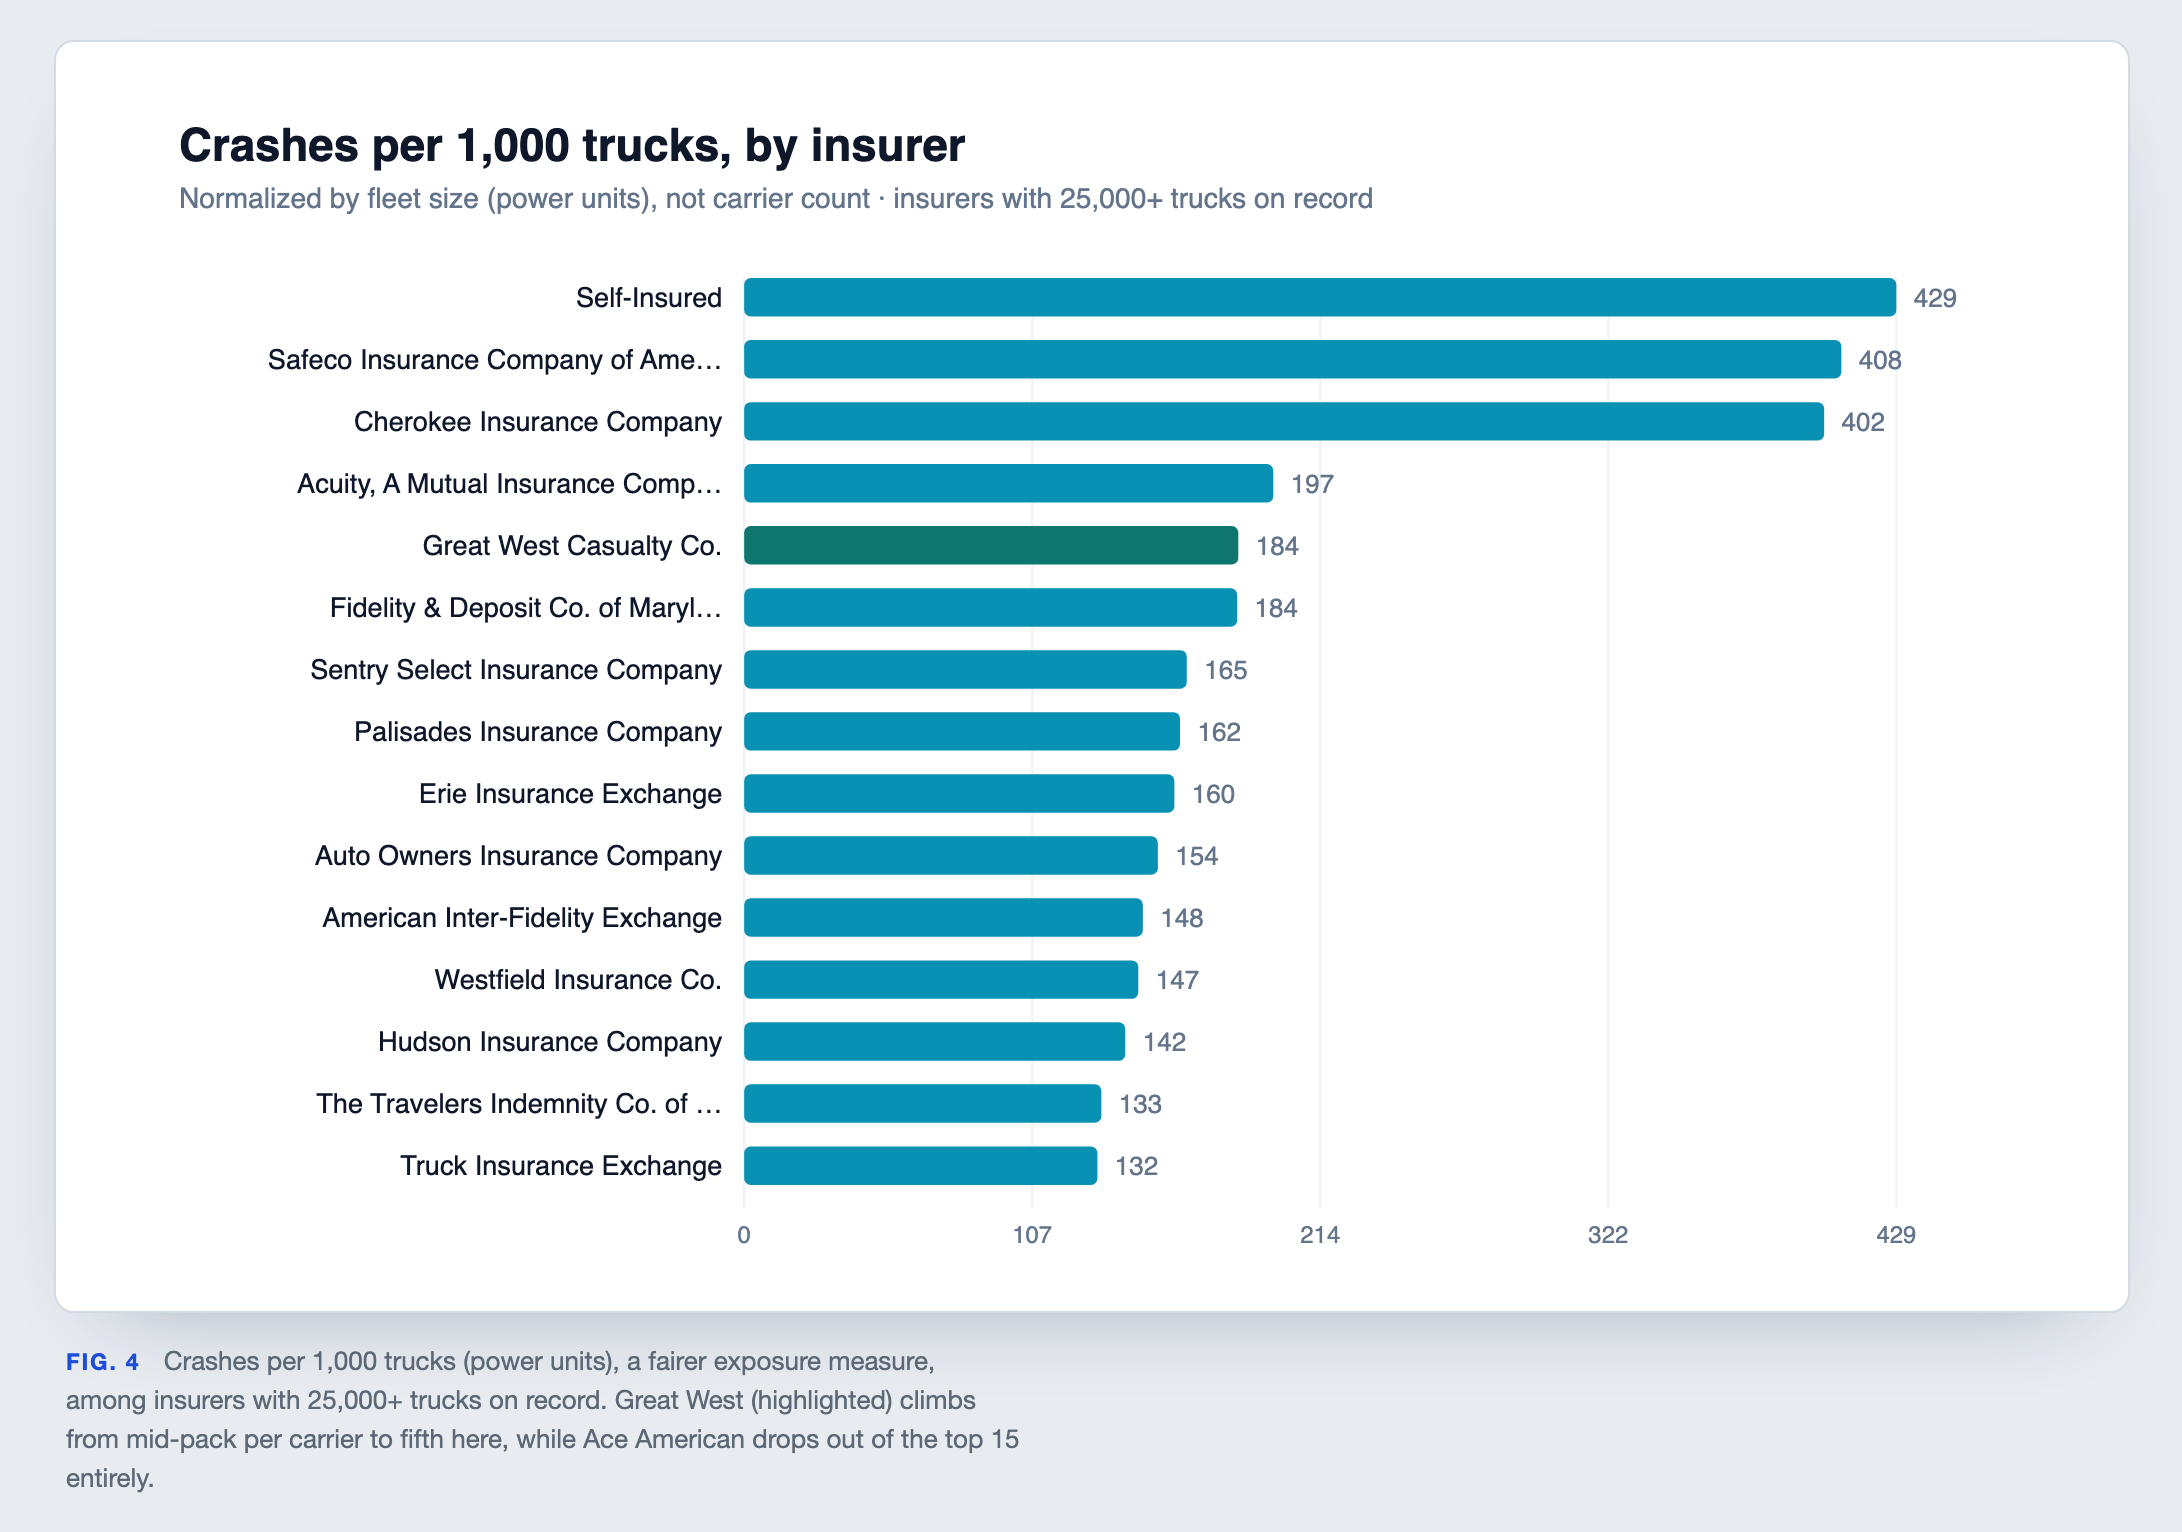
But even "per carrier" is a proxy, because a carrier can be a single van or a five-thousand-truck fleet. Divide instead by trucks, each insurer's total power units, and the ranking flips again. Ace American, the runaway leader per carrier, falls to the middle of the pack: its clients are enormous fleets, so spread across their trucks the rate is ordinary. Great West moves the other way, rising to fifth among the large insurers at about 184 crashes per 1,000 trucks, because its book is thousands of small operators, and small trucking outfits crash more per truck. Above it sit only the self-insured mega-fleets and a couple of specialty writers. The lesson is less "who is worst" than how completely the answer depends on the denominator you pick.
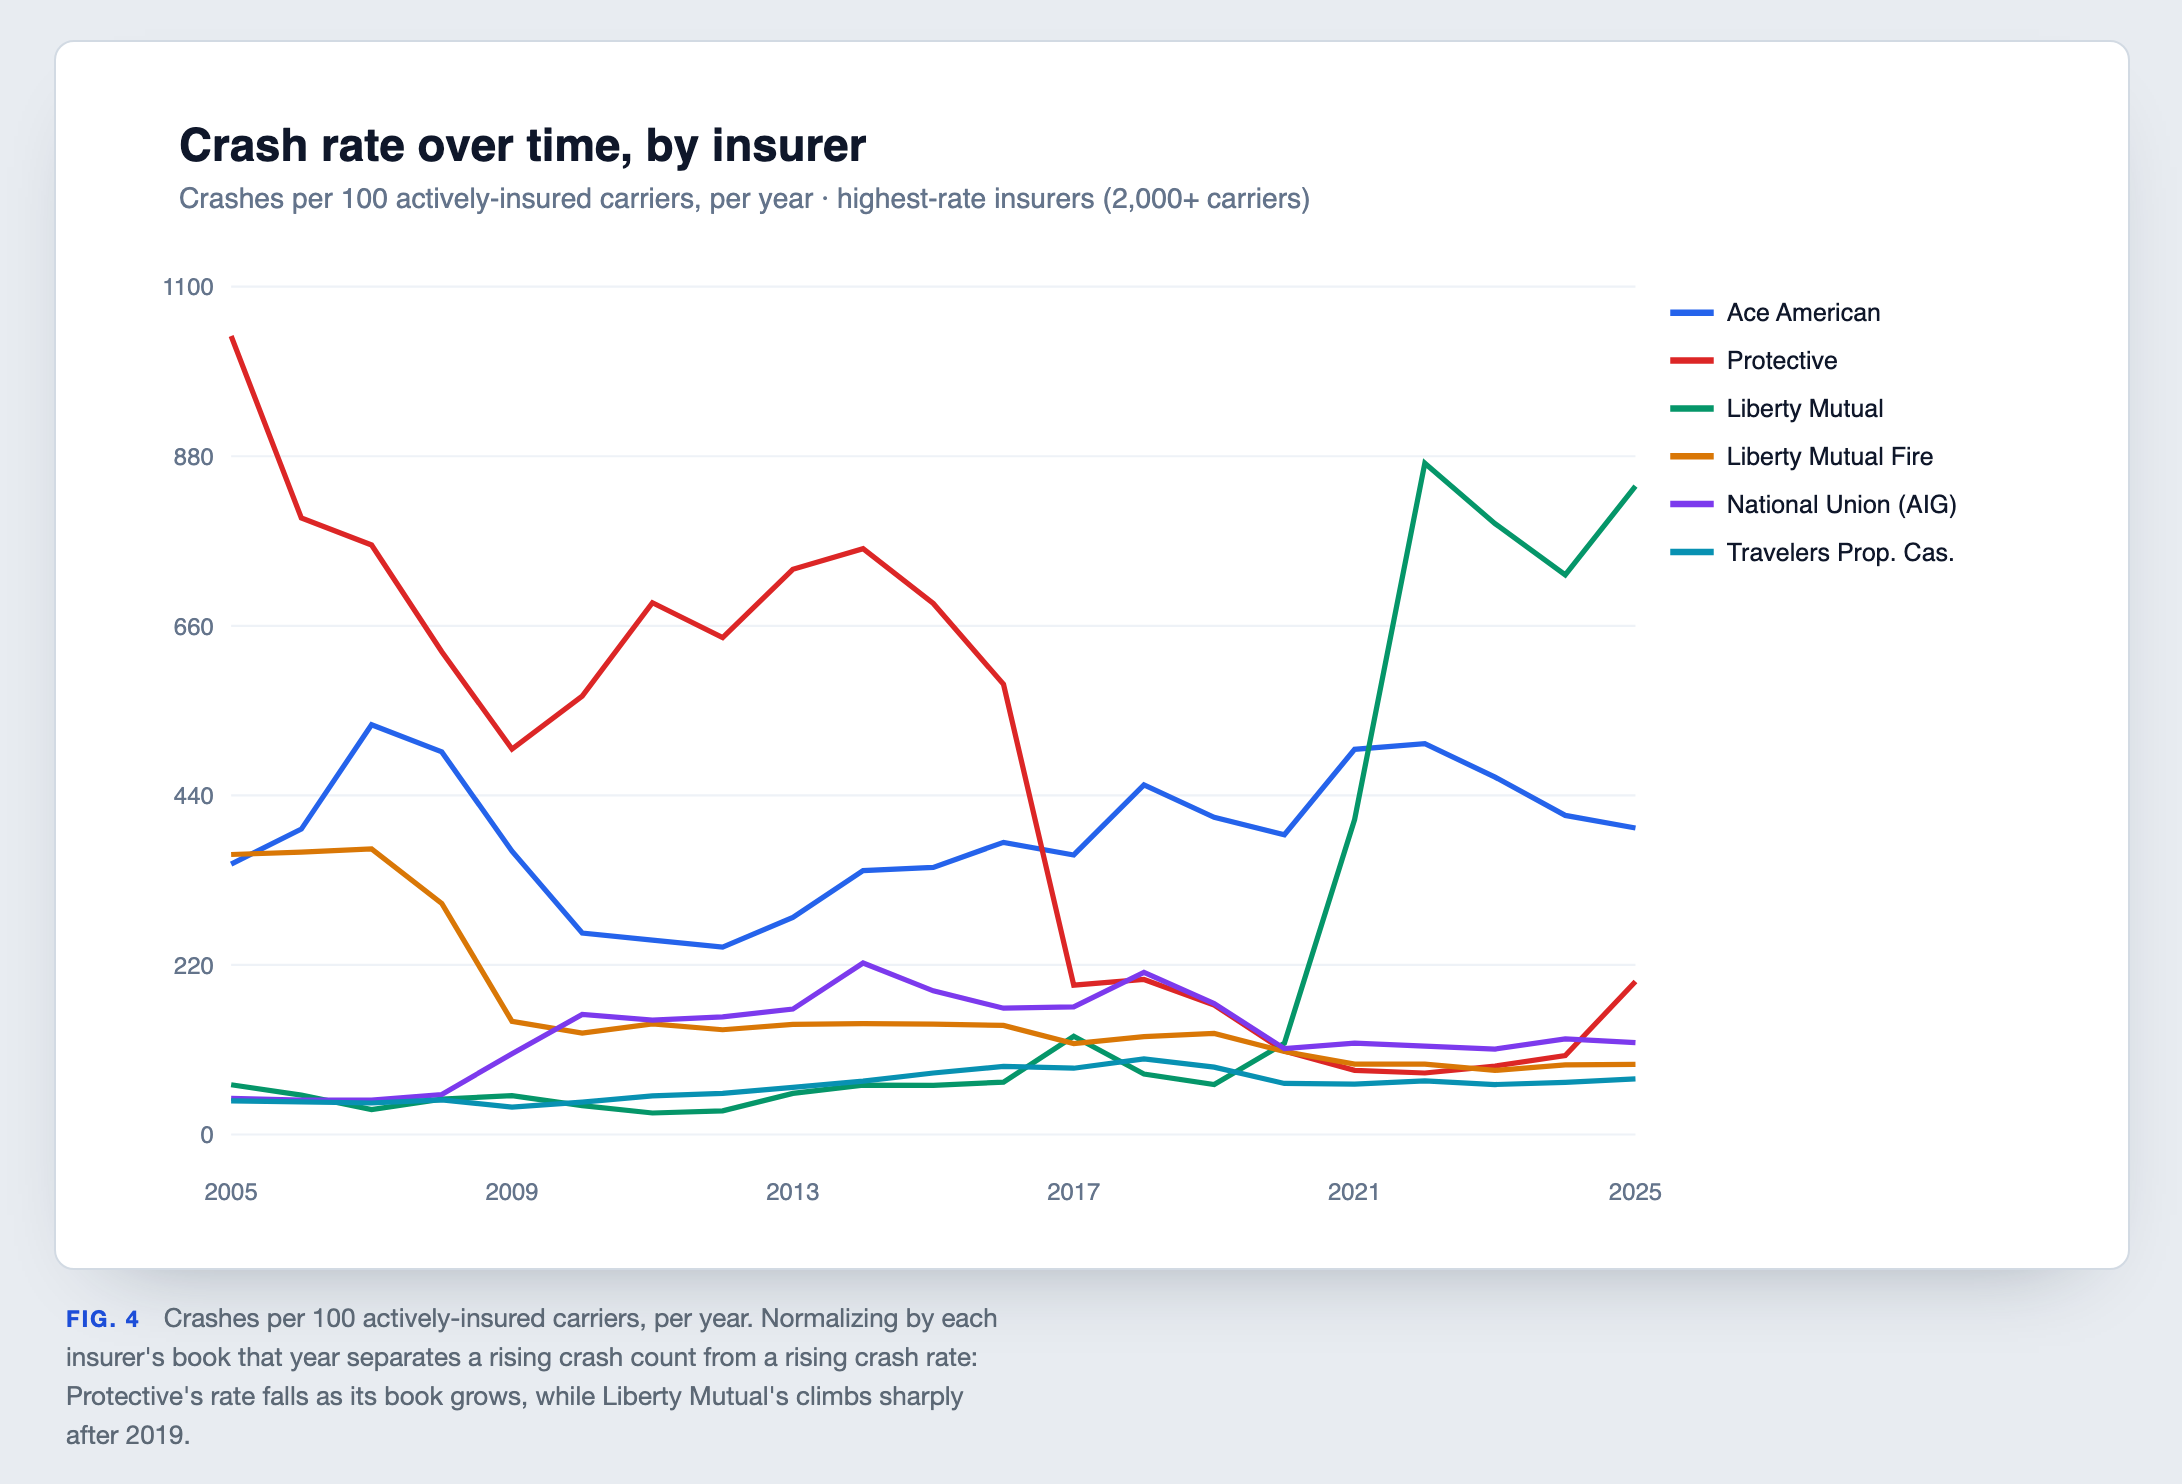
Those all-time snapshots hide a further question: is a given book getting safer or riskier over time? Dividing each insurer's crashes each year by the carriers it actively insured that year answers it, and the trajectories diverge sharply. Protective ran above 700 crashes per 100 carriers through the early 2010s, then fell below 100 as it more than tripled its book: its raw crash count rose while its rate collapsed. Liberty Mutual moved the other way, jumping from under 70 before 2019 to roughly 840 by 2025 on a book that barely grew, a genuine rise in per-carrier crash intensity rather than an artifact of size. Ace American stays structurally high throughout, the signature of an insurer whose handful of carriers are giant, crash-heavy fleets.
Not all crashes weigh the same
Fatalities per 1,000 crashes separates a fender-bender book from a highway-speed one.
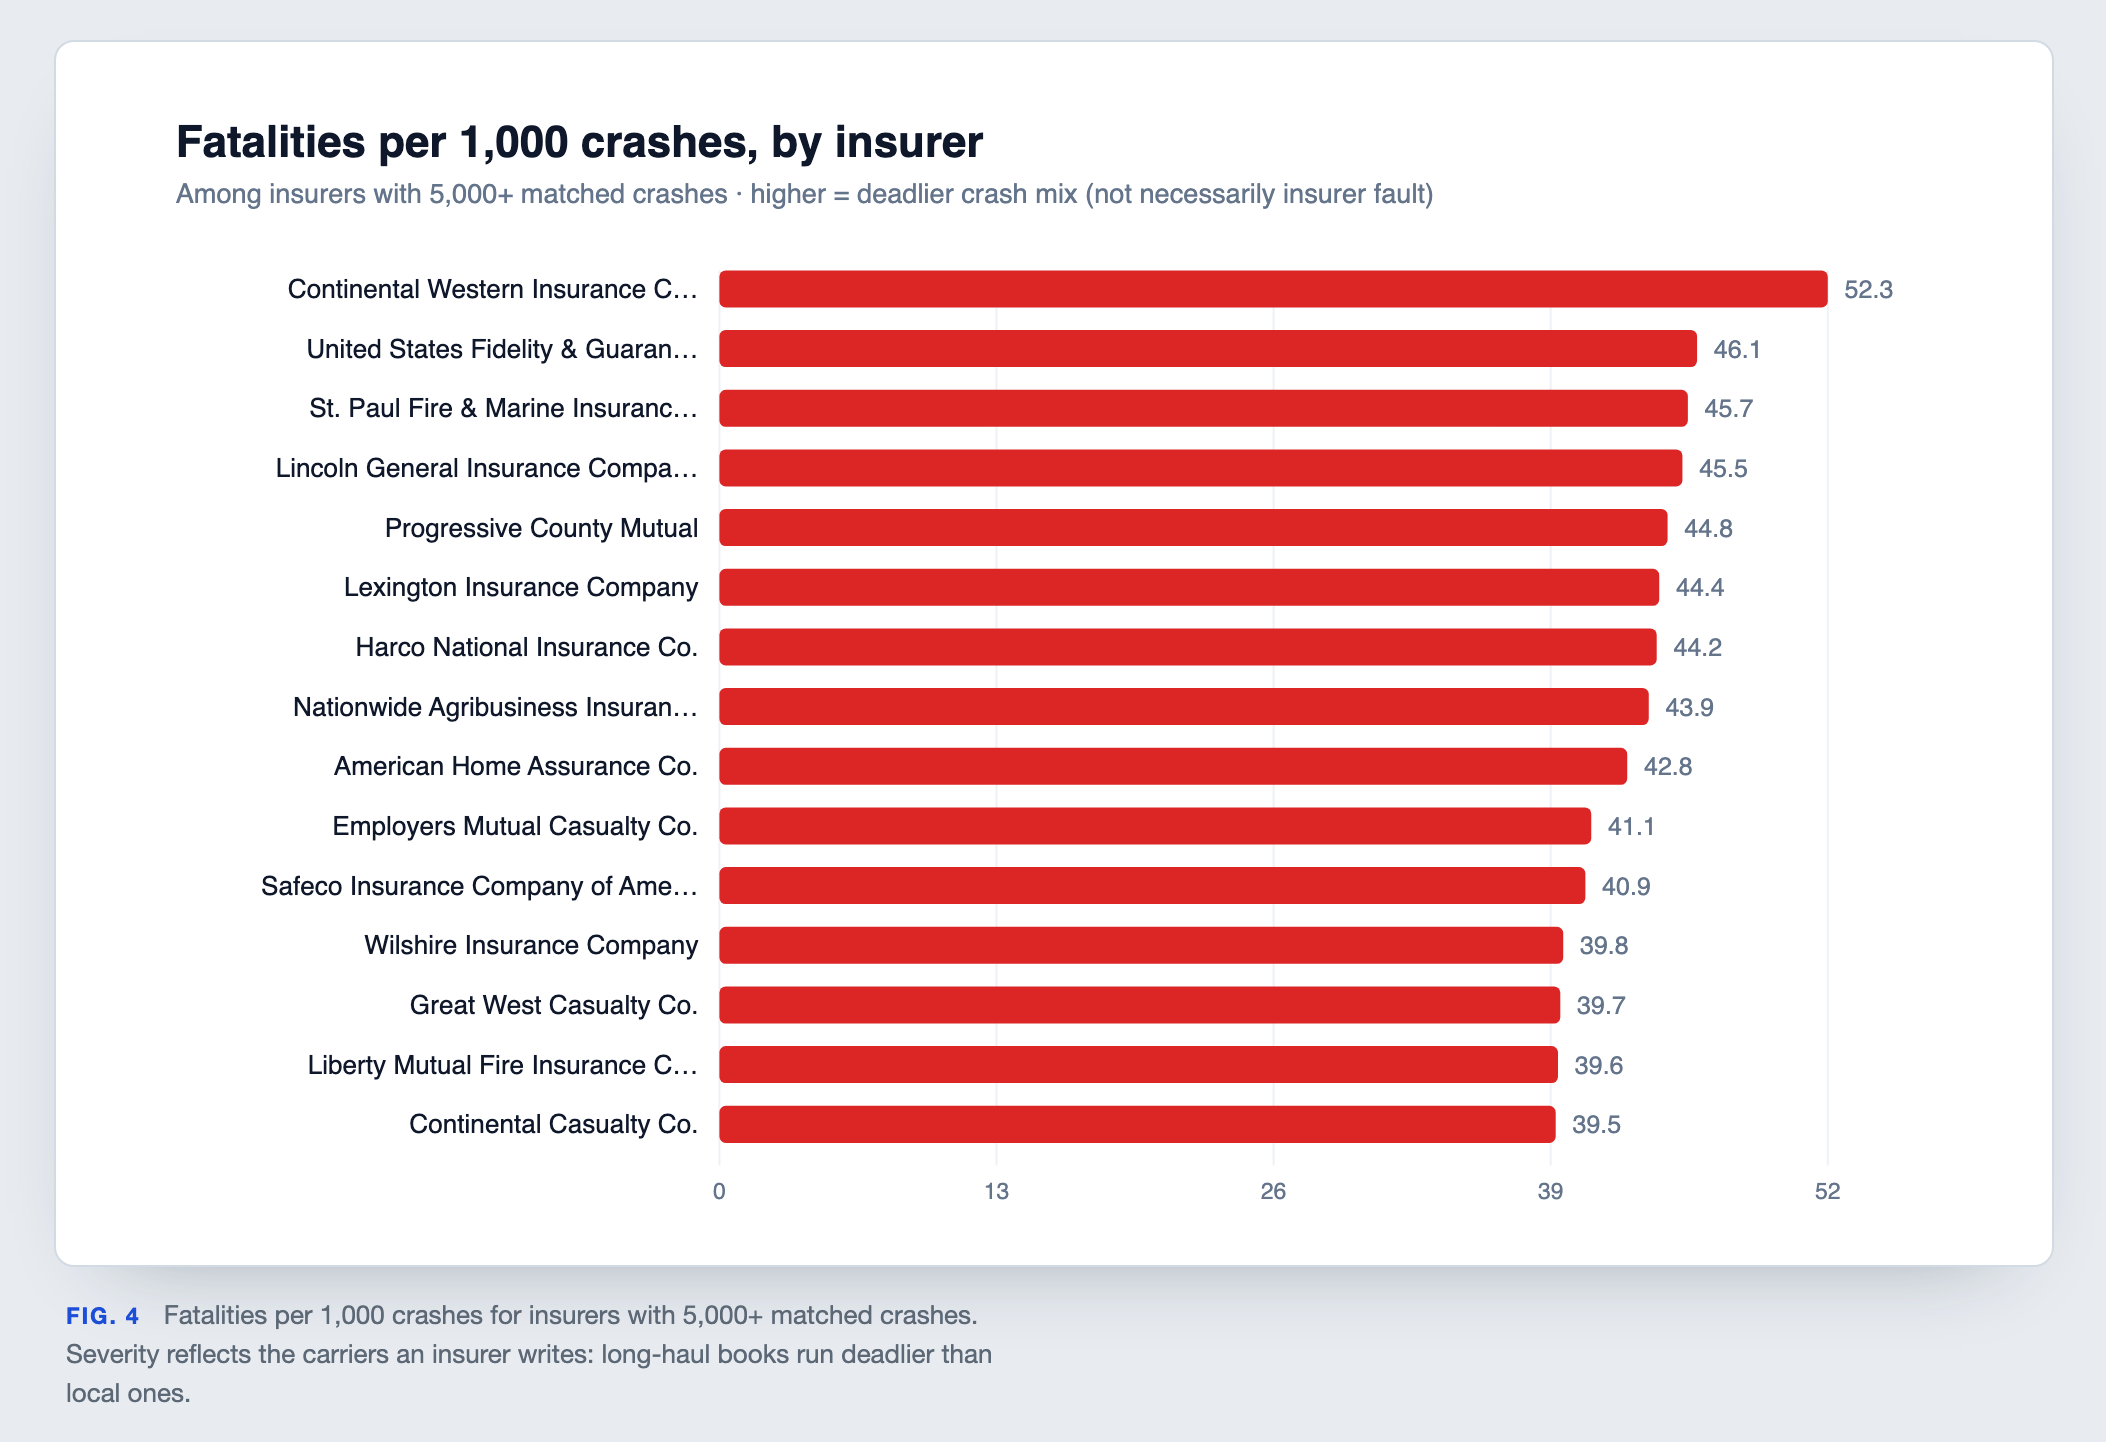
Frequency is one axis; severity is another. Weighting by fatalities per 1,000 crashes surfaces a different set of names: Continental Western (52.3), US Fidelity & Guaranty (46.1) and St. Paul Fire & Marine (45.7) lead, each far above the field. Great West, despite its volume, sits well down the severity list. High severity tends to signal a customer mix skewed toward interstate, high-speed operations rather than anything the insurer controls, but it is exactly the tail that drives loss costs.
How the market moved over time
The same crashes, plotted by year.
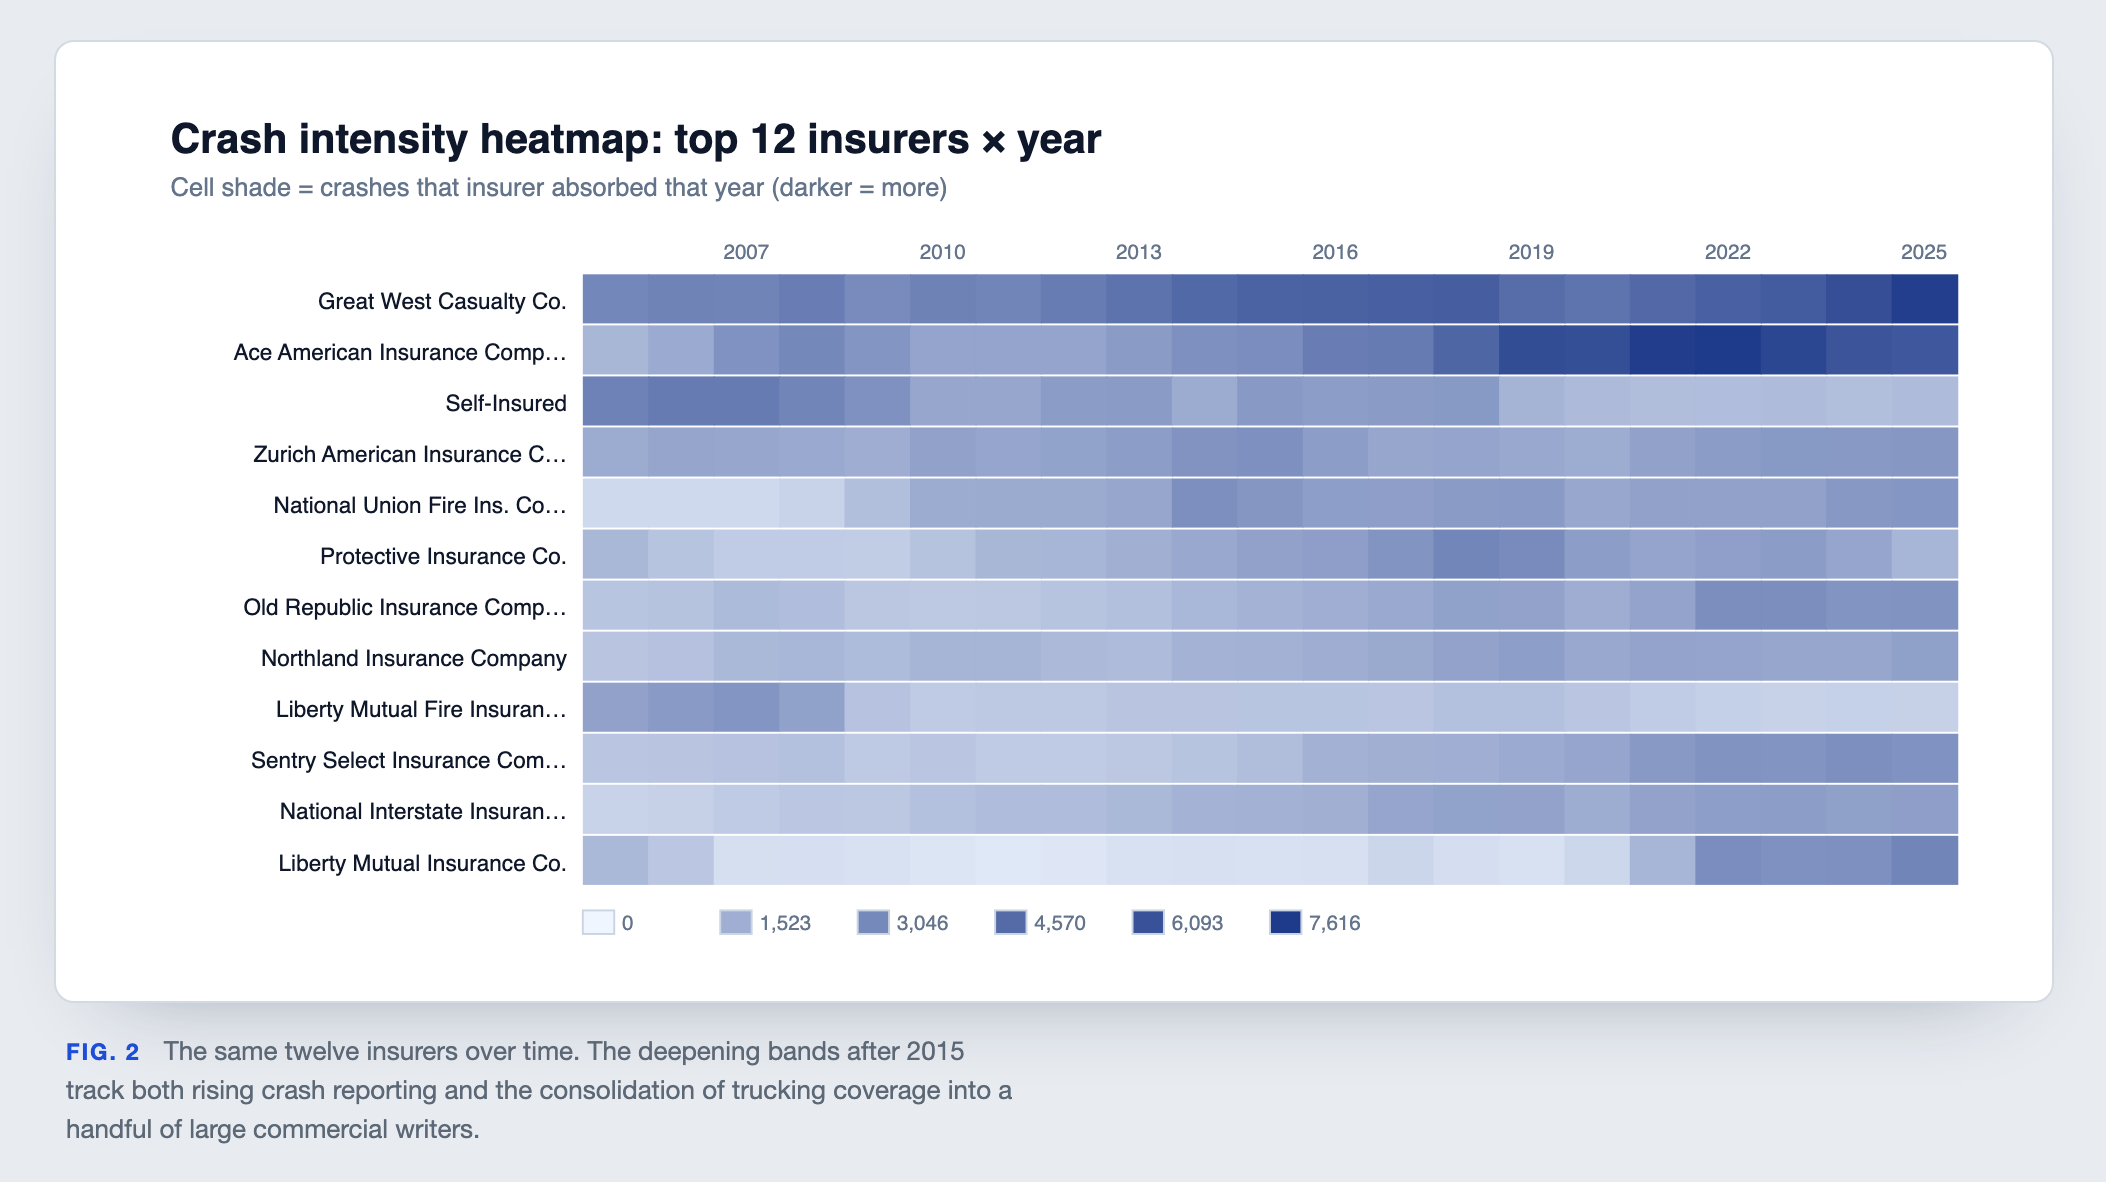
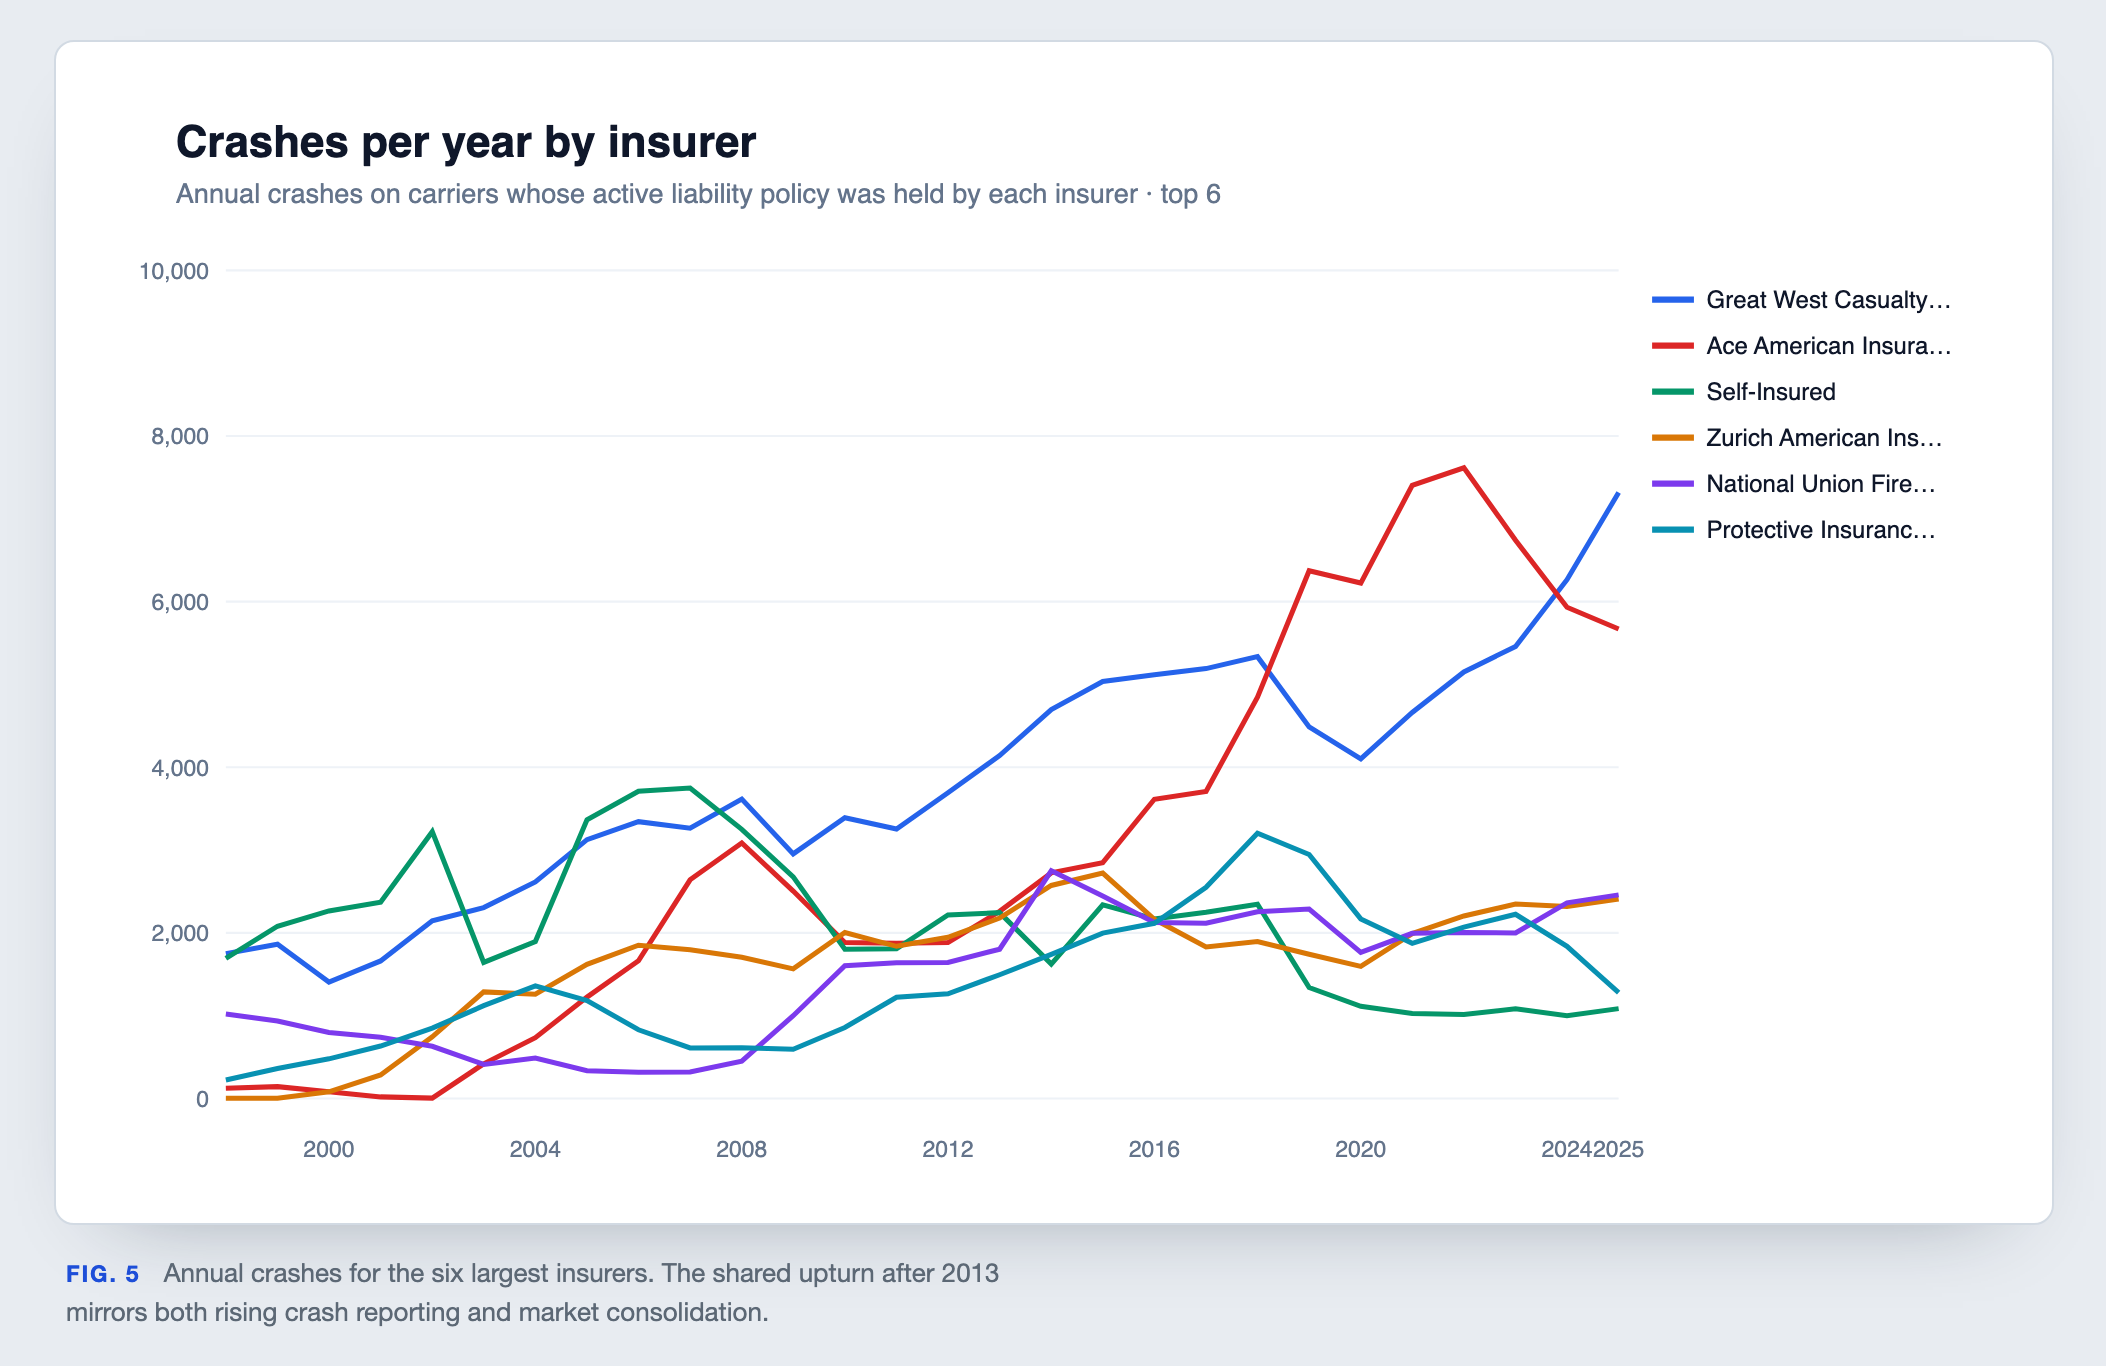
Tracked year by year, the business steadily consolidates into a handful of large commercial writers, with Great West and Ace American pulling away after 2013. Coverage itself is stable: across three decades roughly a third of crashes involve a carrier with no liability policy on record for that date, a share that holds flat through the most recent years once both the historical and current filings are used.
What the ledger shows
Trucking liability is a concentrated business: a dozen commercial writers stand behind the overwhelming majority of the trucks in America's crash record. Who looks "worst" depends entirely on the lens: raw exposure rewards the biggest books, per-carrier rates reward whoever avoids the mega-fleets, and severity tracks the highways more than the underwriters. The most honest read is not a villain but a map of where risk pools and which insurers carry the industry's hardest miles.