
For Sale, Still Rolling

A for-sale listing changes nothing on the road. Half of the listed DOTs with any inspection history kept getting inspected for months afterward — and the record cannot tell you whether the seller or the buyer was driving.
Part 3 of an investigation into the grey market for FMCSA operating authority. Part 1 mapped the market; Part 2 showed that 85% of sales never touch the federal record. Figures and methodology at the end.
Part 2 ended with the record's silence: companies change hands and FMCSA never hears about it. This part asks the operational question that silence raises. While an authority sits on the market — and after it quietly sells — what are the trucks attached to that number actually doing? Nothing in a federal lookup will tell you. The roadside record will.
What we measured
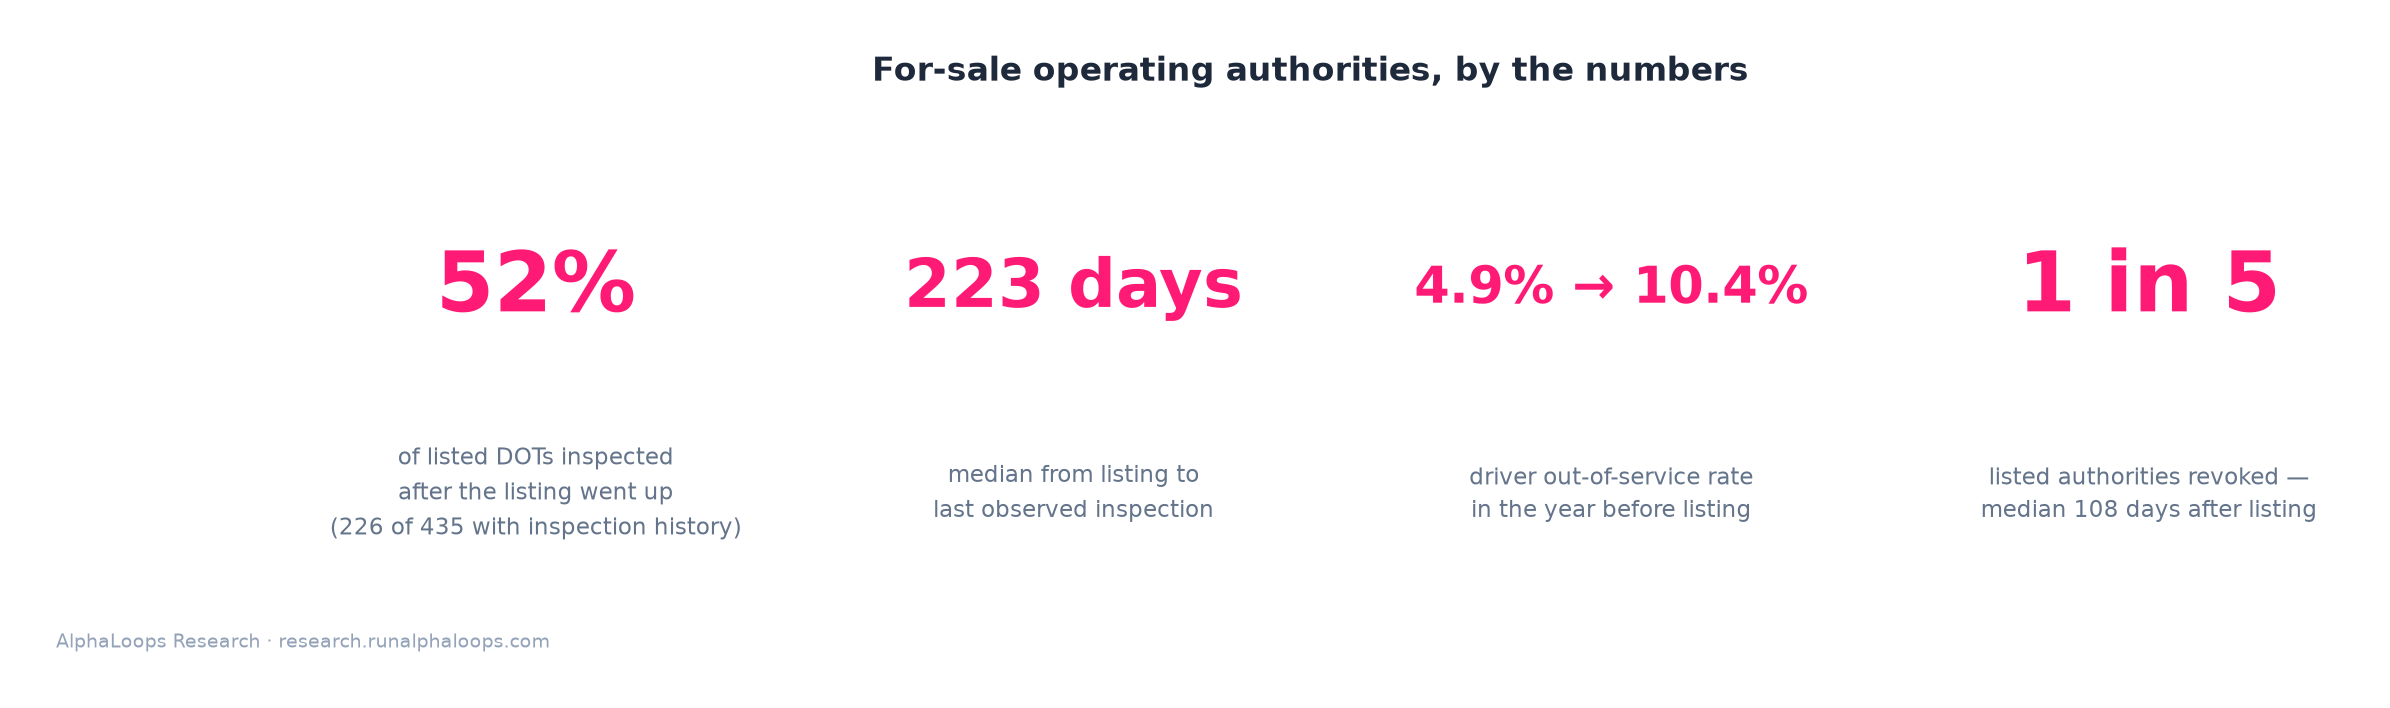
We resolved 592 high-confidence for-sale carriers from the channels and marketplaces we monitor — not a census of the market — and matched them to their federal records. Most sellers never post identifying numbers (in a hand-verified sample, 20 of 25 listings included no DOT or MC), so matching runs through officer names, phone numbers, and masked digits. We then joined each carrier's first observed listing date against its full FMCSA roadside-inspection and authority history: 435 of the 592 had inspection history, 5,242 inspections in all.
1. The DOT never leaves the road
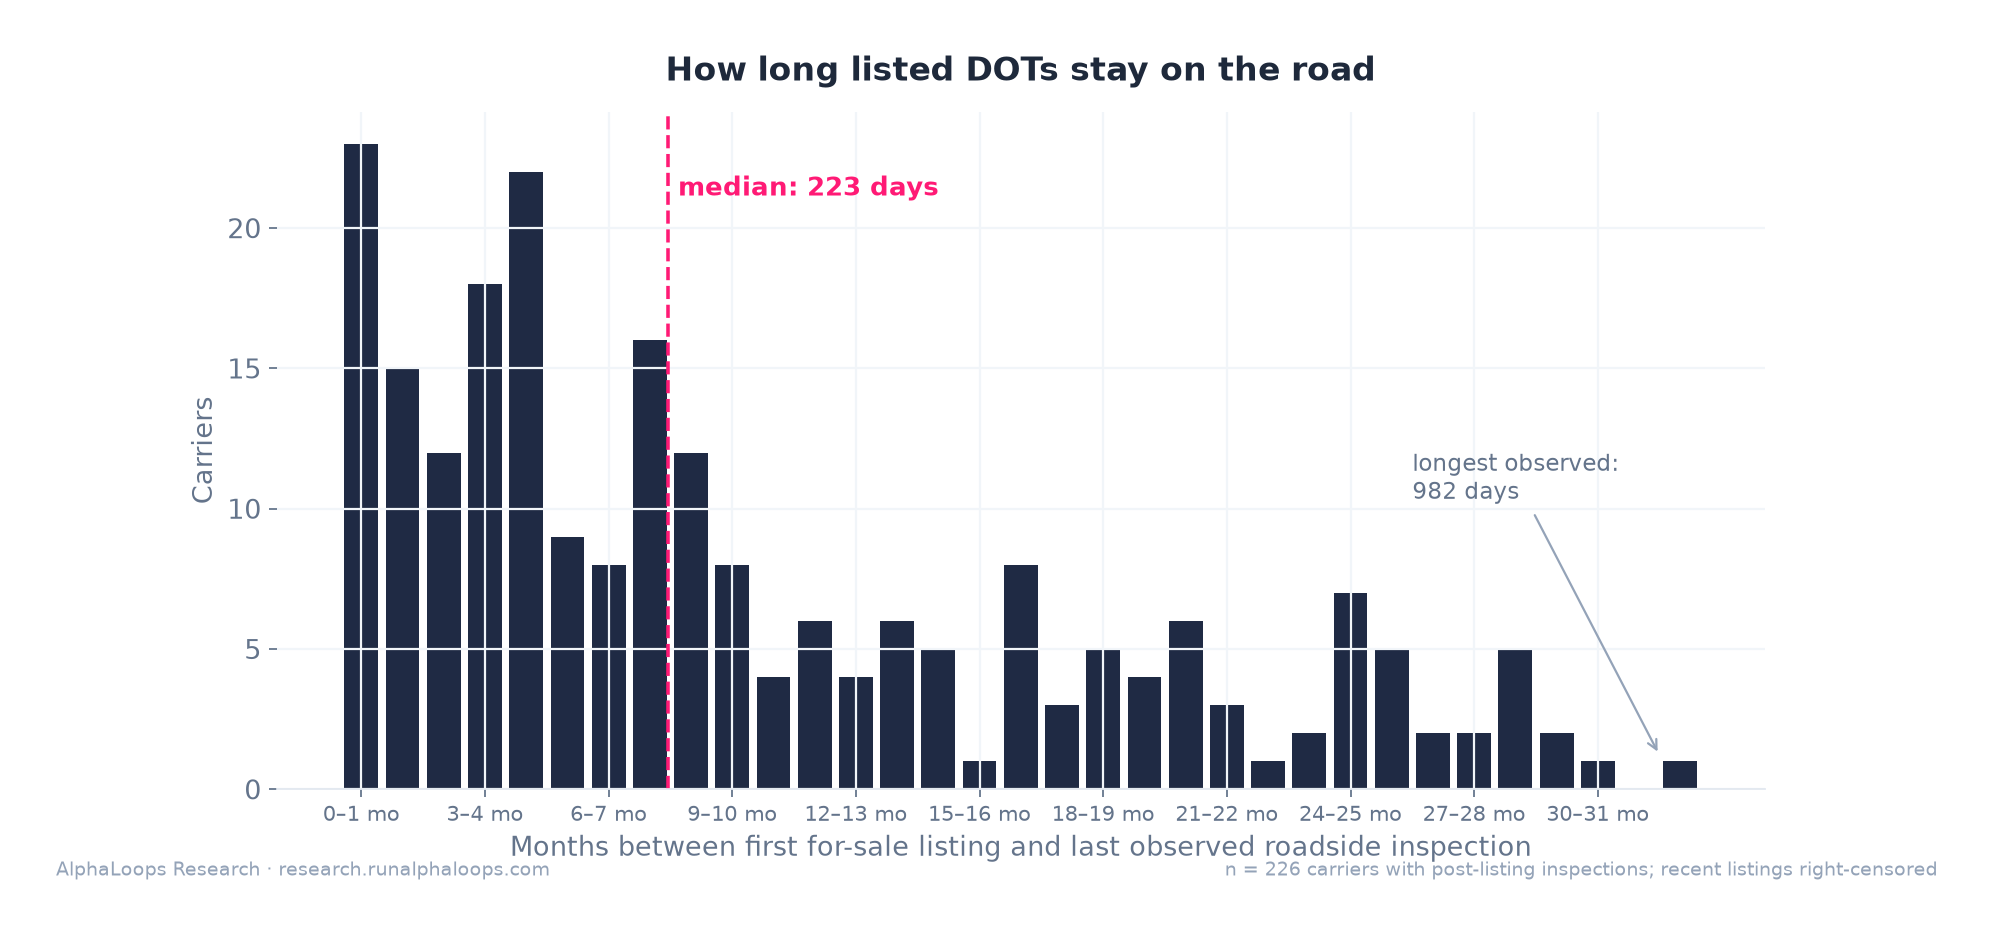
Of the 435 listed carriers with inspection history, 52% (226) kept receiving roadside inspections after the authority went up for sale — 1,228 post-listing inspections in total. The median listed DOT was still being inspected 223 days after its first listing; a quarter were still out there past 481 days, and the longest observed gap is 982 days. Many listings are recent, so these durations are right-censored — the true tail is longer.
And 52% is a floor, not a ceiling: roadside inspections sample this population only about 1.5 to 3.9 times per carrier-year, so a missing post-listing inspection is not evidence anyone stopped — 104 of the 209 DOTs we never saw inspected again still hold active operating authority today.
Here is what a post-listing inspection actually proves: the number was operating. Not who was operating it. Given Part 2's finding — 85% of completed sales never touch the federal record — the truck at that weigh station could be the seller finishing out, or the buyer already running under the purchased authority. There is no way to tell. The asset never leaves the road, and the name behind the wheel is anyone's guess. That is the silence in the registration record, showing up in the physical world.
2. The roadside record shows the sale the federal record hides
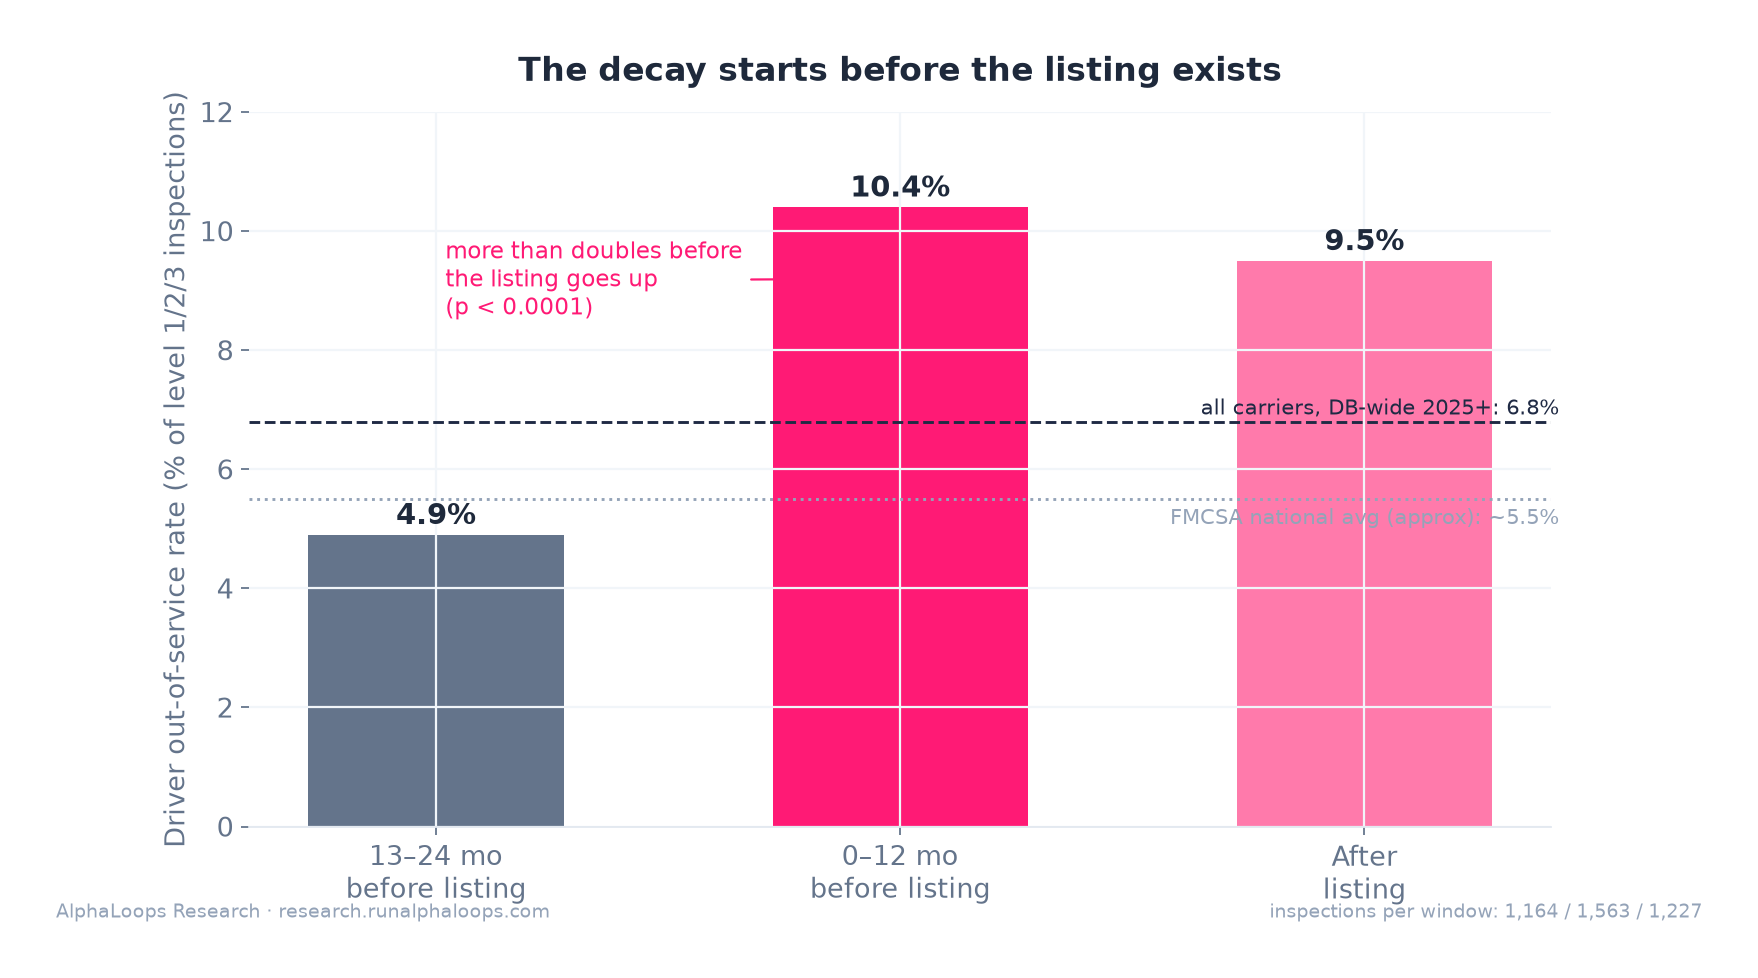
Before the listing, attribution is clean — it is unambiguously the seller's operation — and the seller's own record shows the letting-go. Using each carrier's earlier history as its own baseline, the driver out-of-service rate more than doubles in the year before listing: from 4.9% in months 13–24 pre-listing to 10.4% in the final 12 months before the for-sale post appears (p < 0.0001), against a 6.8% database-wide control and a national average around 5.5%. Driver OOS violations — hours-of-service problems, logbook falsification, suspended licenses — are the compliance-culture metric, and a doubling inside the same population's own timeline can't be explained by fleet mix. The listing is a lagging indicator of a decision already made.
After the listing, attribution goes dark — the number may be in either party's hands — but the post-listing record still sorts the listings that die from the ones that don't. DOTs that went on to lose their authority ran 2.29 violations per inspection while listed, versus 1.56 for those that stayed active (+47%); their vehicle OOS rate was 33.3% vs 24.3%, and their driver OOS rate was 13.9% vs 8.6% — roughly 2.5x the national average. Whoever holds the keys, decay before the listing is the seller checking out, and dirtiness after it marks the numbers heading for authority death.
3. One in five listings ends in revocation, not a sale
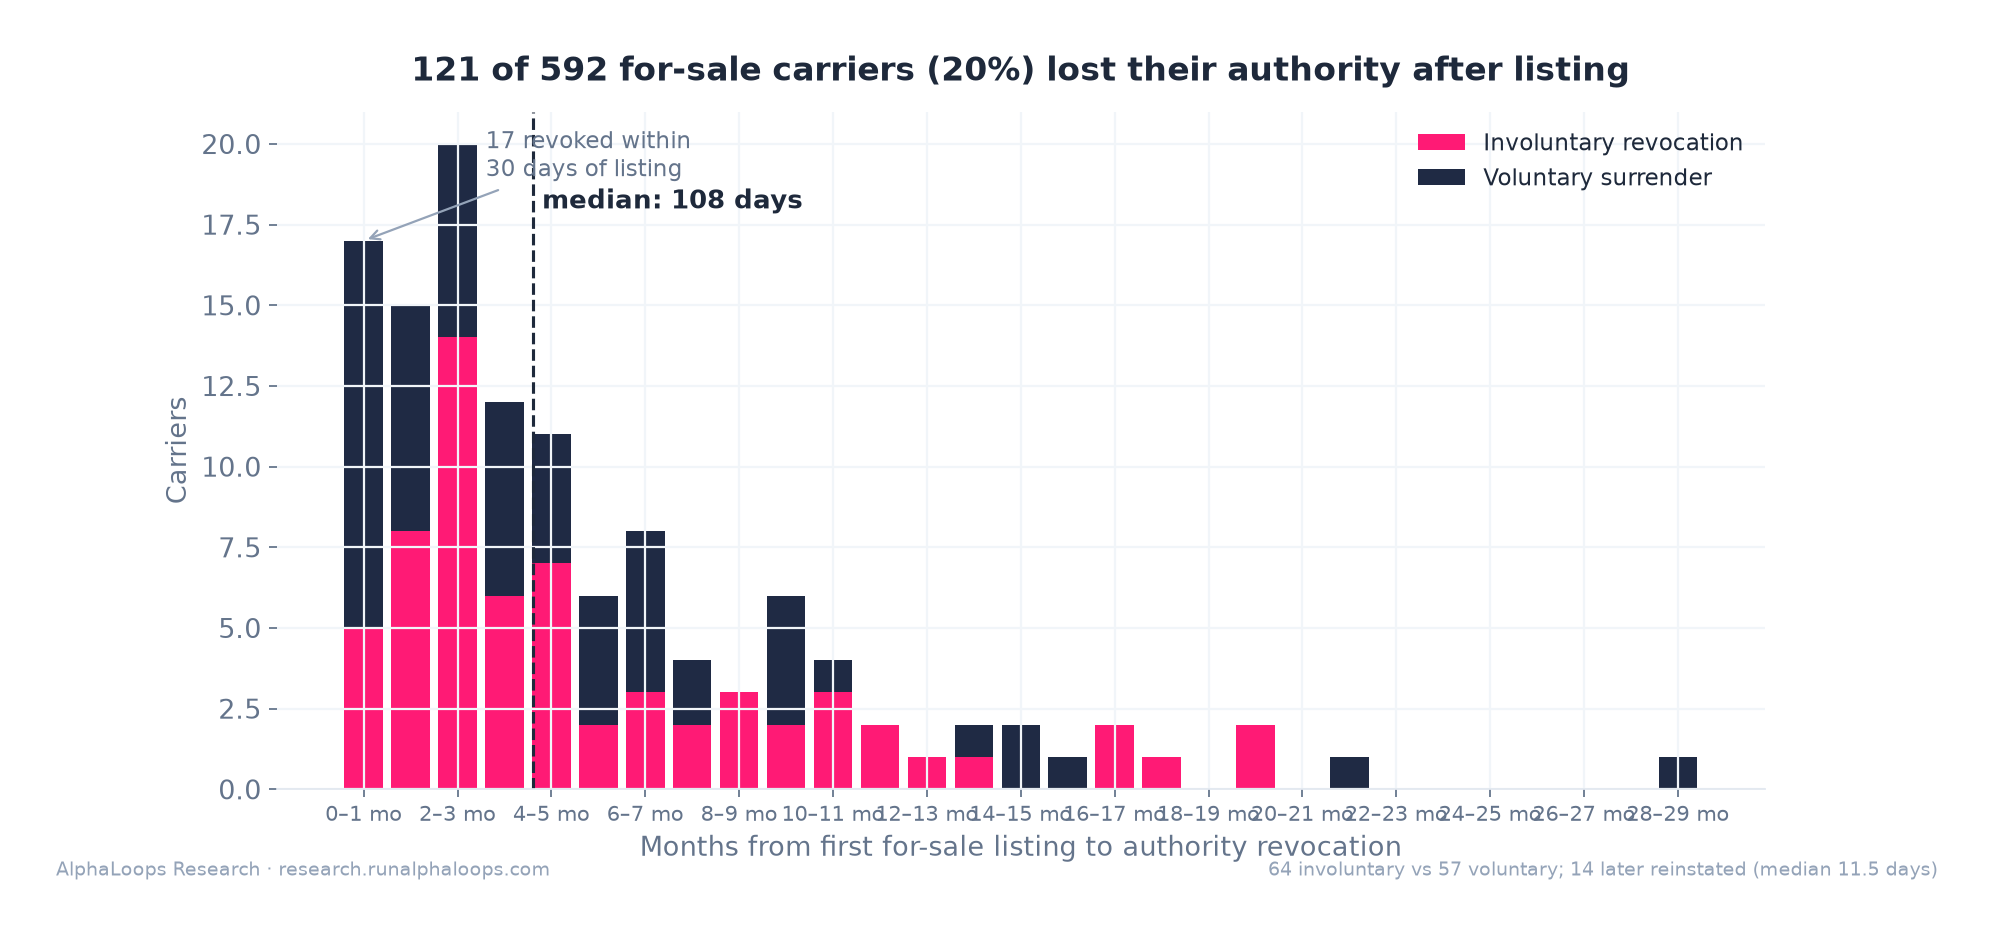
121 of the 592 (20%) lost their operating authority on or after the listing date, at a median of 108 days from listing to revocation (IQR 49–219). Seventeen were revoked within 30 days of listing. The split between voluntary surrenders (57) and involuntary revocations (64) was nearly even — a pattern that reads more like distress sales than orderly retirements. For these numbers, the listing wasn't the start of a transition. It was a countdown.
What this means if you book, insure, or ship freight
For brokers: a listed DOT means months of bookable-pool exposure — with no way to know who is dispatching the trucks your point-in-time check just approved.
For insurers: the listing arrives with underwriting-relevant lead time before the revocation — lead time that exists nowhere in a standard submission.
For shippers: the disappearing-carrier profile is identifiable in advance: listed for sale, with a roadside record getting worse. That is the profile behind mid-shipment disappearances and unrecoverable claims.
Seeing the exit before it happens
None of this is visible in an MC lookup, a safety score, or an insurance certificate — the signals live in marketplaces that never touch a federal record, posted by sellers who deliberately omit their identifying numbers. AlphaLoops resolves those listings back to real DOT numbers and surfaces carrier-exit signals — for-sale status, listing dates, and the deterioration patterns around them — in the platform and API, alongside the authority and inspection data you already use. If a number in your network is quietly heading for the exit, or already belongs to someone new, you should know.
Methodology notes: Population is 592 high-confidence for-sale carriers with dated listings resolved from the channels and marketplaces we monitor — not a census; observed listing volume has grown with our source coverage and should not be read as market size. OOS rates are computed as the share of relevant-level inspections with at least one OOS violation — consistent across our windows and controls, but not identical to official FMCSA OOS methodology; national figures are approximate benchmarks. The database-wide control spans all carrier sizes, and for-sale carriers skew small, so part of the gap versus the control (though not the within-population doubling) may reflect size mix. The outcome split rests on 227 post-listing inspections for later-revoked DOTs vs 997 for still-active ones; both OOS gaps are significant at p < 0.05. Recent listings are right-censored, so time-on-road figures understate true durations; and because inspection sampling is sparse (~1.5–3.9 inspections per carrier-year in this population), the absence of a post-listing inspection is not evidence that operation ceased.